Net benefit increased up to 19% by application of KNO3 compared to other granular K-sources containing KCl or K2SO4 in a scientifically designed trial investigating yield of Williams banana in South Africa
Large differences in Williams banana plant performance were found in a scientific trial, testing the response to fertilisation with prilled potassium nitrate (KNO3: as Qrop® KS), potassium sulphate (K2SO4) or potassium chloride (KCl). The banana yield (total hand weight) average across two varied N and K rates was best for Qrop® KS with 35,4 MT/ha, and substantially lower for K2SO4 (32,8 MT/ha, -7%) and KCl (28,5 MT/ha, -20%). Application of Qrop® KS resulted in the best performance in marketable yield and fruit quality parameters. Fruit weight and quality parameters were reduced where KCl was applied: a statistically significant difference. The application of Potassium Nitrate, Qrop® KS, turned out to be a profitable investment for the grower.
The increased total income of 1 291 USD/ha for Potassium Nitrate, Qrop® KS, over SOP returns three times the extra investment of 385 USD/ha and an increased total income of 3 423 USD/ha for Qrop® KS over KCl returns four times the extra investment of 795 USD/ha.
The highest yield of 40 MT/ha was recorded for Qrop® KS, at the higher rates of N and K. N applied at 300 kg N/ha and K applied at 700 kg K/ha (840 kg K2O/ha), resulted in a 24% and 19% higher marketable yield, relative to less N (200 kg N/ha) or less K (450 kg K/ha, 540 kg K2O/ha).
Table 1. The three variable factors in the trial. The K-sources were applied to supply the total of the two different K-rates, the total N was balanced with CAN (calcium ammonium nitrate, 28%N) and SSP (single superphosphate, 15% P) is constant for all treatments. The amount of nutrients/ha for treatments varying in the different K sources is given as an example of how the K -source affects the ratio of N-NO3:N-NH4, S and Cl in this table only for the high N and K rate treatments.

The trial was set up in the Lowveld region of South Africa in collaboration with AgNova (Pty) Ltd a factorial design with randomised complete blocks in which three K-sources, two N-rates and two K-rates were varied; in total 12 treatment combinations with 20 replicates each. This enabled to show that differences between Qrop® KS and KCl were statistically significant at the 5% level for all measurements except for bunch weight which nevertheless showed a strong decline using KCl. It might be concluded that chloride uptake negatively impacted on plant growth and thus total yield. Alternatively or additionally, the potassium nitrate applied as Qrop® KS may have given rise to improved nutrition and thus plant health due to the enhanced ability of increased nitrates to promote the uptake of the other cation plant nutrients, which make up the bulk of the nutrient salts required by plants.

Figure 1. Preparation of the planting area after cross-ripping and disking.

Figure 2. Installed micro-sprinklers, driplines, the photograph is taken at the time of the second application of N and K fertilisers in June 2019.
Trial details
Details of the three variable factors of the trial are given in Table 1. Phosphate was applied at the time of planting. 31,5 kg of P/ha (72 kg P2O5/ha) was applied with single super phosphate (15% P). Nitrogen was applied as CAN (28% N) in treatments with K2SO4 and KCl. For the Qrop® KS treatments, the amount of nitrogen supplied as CAN was reduced with the amount of N-NO3 applied with potassium nitrate. All treatment plots received one foliar spray application of a micronutrients cocktail during spring.
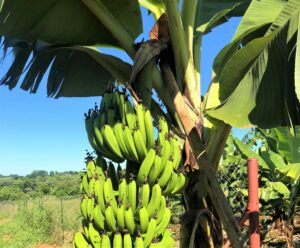
Per treatment, 20 individual plants were assigned as replicas in a completely randomised block design. Plants were planted in virgin soil, on a site ripped and leveled the year before planting (Figure 1). The soil was of the Hutton series, with pHKCl 5,6 and CEC 4,2 cmol kg-1 soil with 71,2 % Ca2+ - 23,6% Mg2+ - 2,7% K+ and 2,1% Na+. P content was 3 mg/kg (Bray1). Williams banana plants (tissue cultured) were planted early January 2019 and harvest commenced on the 25th of June 2020 (Figures 2-5). Spacing was 3m x 2m (1 667 plants/ha).
In February, June and December, the plants were given N and K by granular fertiliser application at the plant’s base, and water was supplied with micro-irrigation in weeks with low precipitation (<20 mm/wk) between April 2019-March 2020. To assess the bunch productiveness, the following parameters of yield were recorded: Total bunch weight (including rachis), number of hands per bunch, weight of each hand, total weight of hands, number of fingers on each hand, finger length of two central fingers in each hand and girth (circumference) of the two chosen fingers in each hand.
Table 2. Yield parameter, means of the main effects per factor. The data was analysed with a suitable statistical method: ANOVA for main effects and interactions, followed by 95% LSD mean separation for factor means. Means followed by the same letters in the same factor are not statistically different at p<0,05.
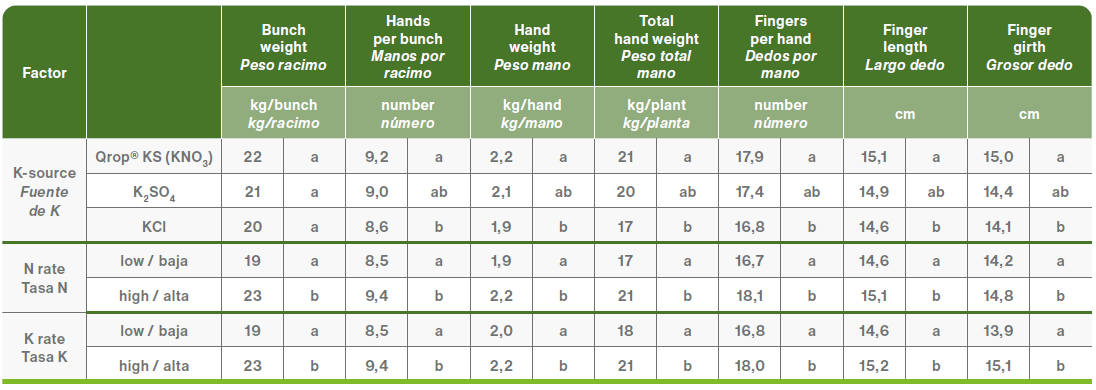

Figure 3. Early March, bunch development a few weeks after emergence.

Figure 4. Harvest time. Bunch harvesting commenced June 25, 2020.
Table 3. Financial analyses of revenue in this trial. The analyses departs from the mean effect in yield of the different K-sources over the varied rates of N and K.


Figure 5. Ready for bunch quality assessments. Bunches were cut off 20 cm above the most distal hand.

Figure 6. Total marketable yield, and the relative difference compared to Qrop® KS of Williams banana plants fertilised with potassium nitrate (Qrop® KS ), potassium sulphate (K2SO4) or potassium chloride (KCl) as K-source.
Results Highlights
The detailed results of the bunch analyses are given in Table 2 and the marketable yield of the K-sources compared to potassium nitrate in Qrop® KS is plotted in Figure 6. All measurements bore positive relationships with each other. Larger bunches thus have more hands, and heavier hands bearing more, longer fingers of greater girth. Increased bunch weight signifies increases of all the attributes. No interactions between the three factors (K-source, N-rate or K-rate) were found. Using Qrop® KS as K-source, resulted in the greatest plant productiveness in marketable total hand weight, with increased return on investment for the grower. Increased N and K levels enhanced productiveness, which probably relates to the high demand of a banana crop for both nutrients as well as the infertile state of the soil in which the plants of the trial were planted.
Application of KCl reduced total hand weight by an order of 20% compared to the bunches produced by plants fertilised with KNO3 for K, and 13% relative to bunches produced by the plants fertilised with K2SO4 for K.
Based on fertiliser costs in 2020, the difference in cost (K source + CAN) between the programs with different K-source was: 795 USD/ha between Qrop® KS and KCl and 385 USD/ha between Qrop® KS and K2SO4. At 8,82 USD/18 kg box, the increased total income per hectare per crop cycle for the grower is 3 423 USD for Qrop® KS over KCl and 1 291 USD for Qrop® KS over K2SO4 per hectare, which more than compensates for the extra input cost of Qrop® KS (Table 3).